It is now possible to search styles across planners, so you are no longer stuck by the selected planner. In addition, searches have been expanded to see unactivated styles in the search result.
02 Mass-editing in master data
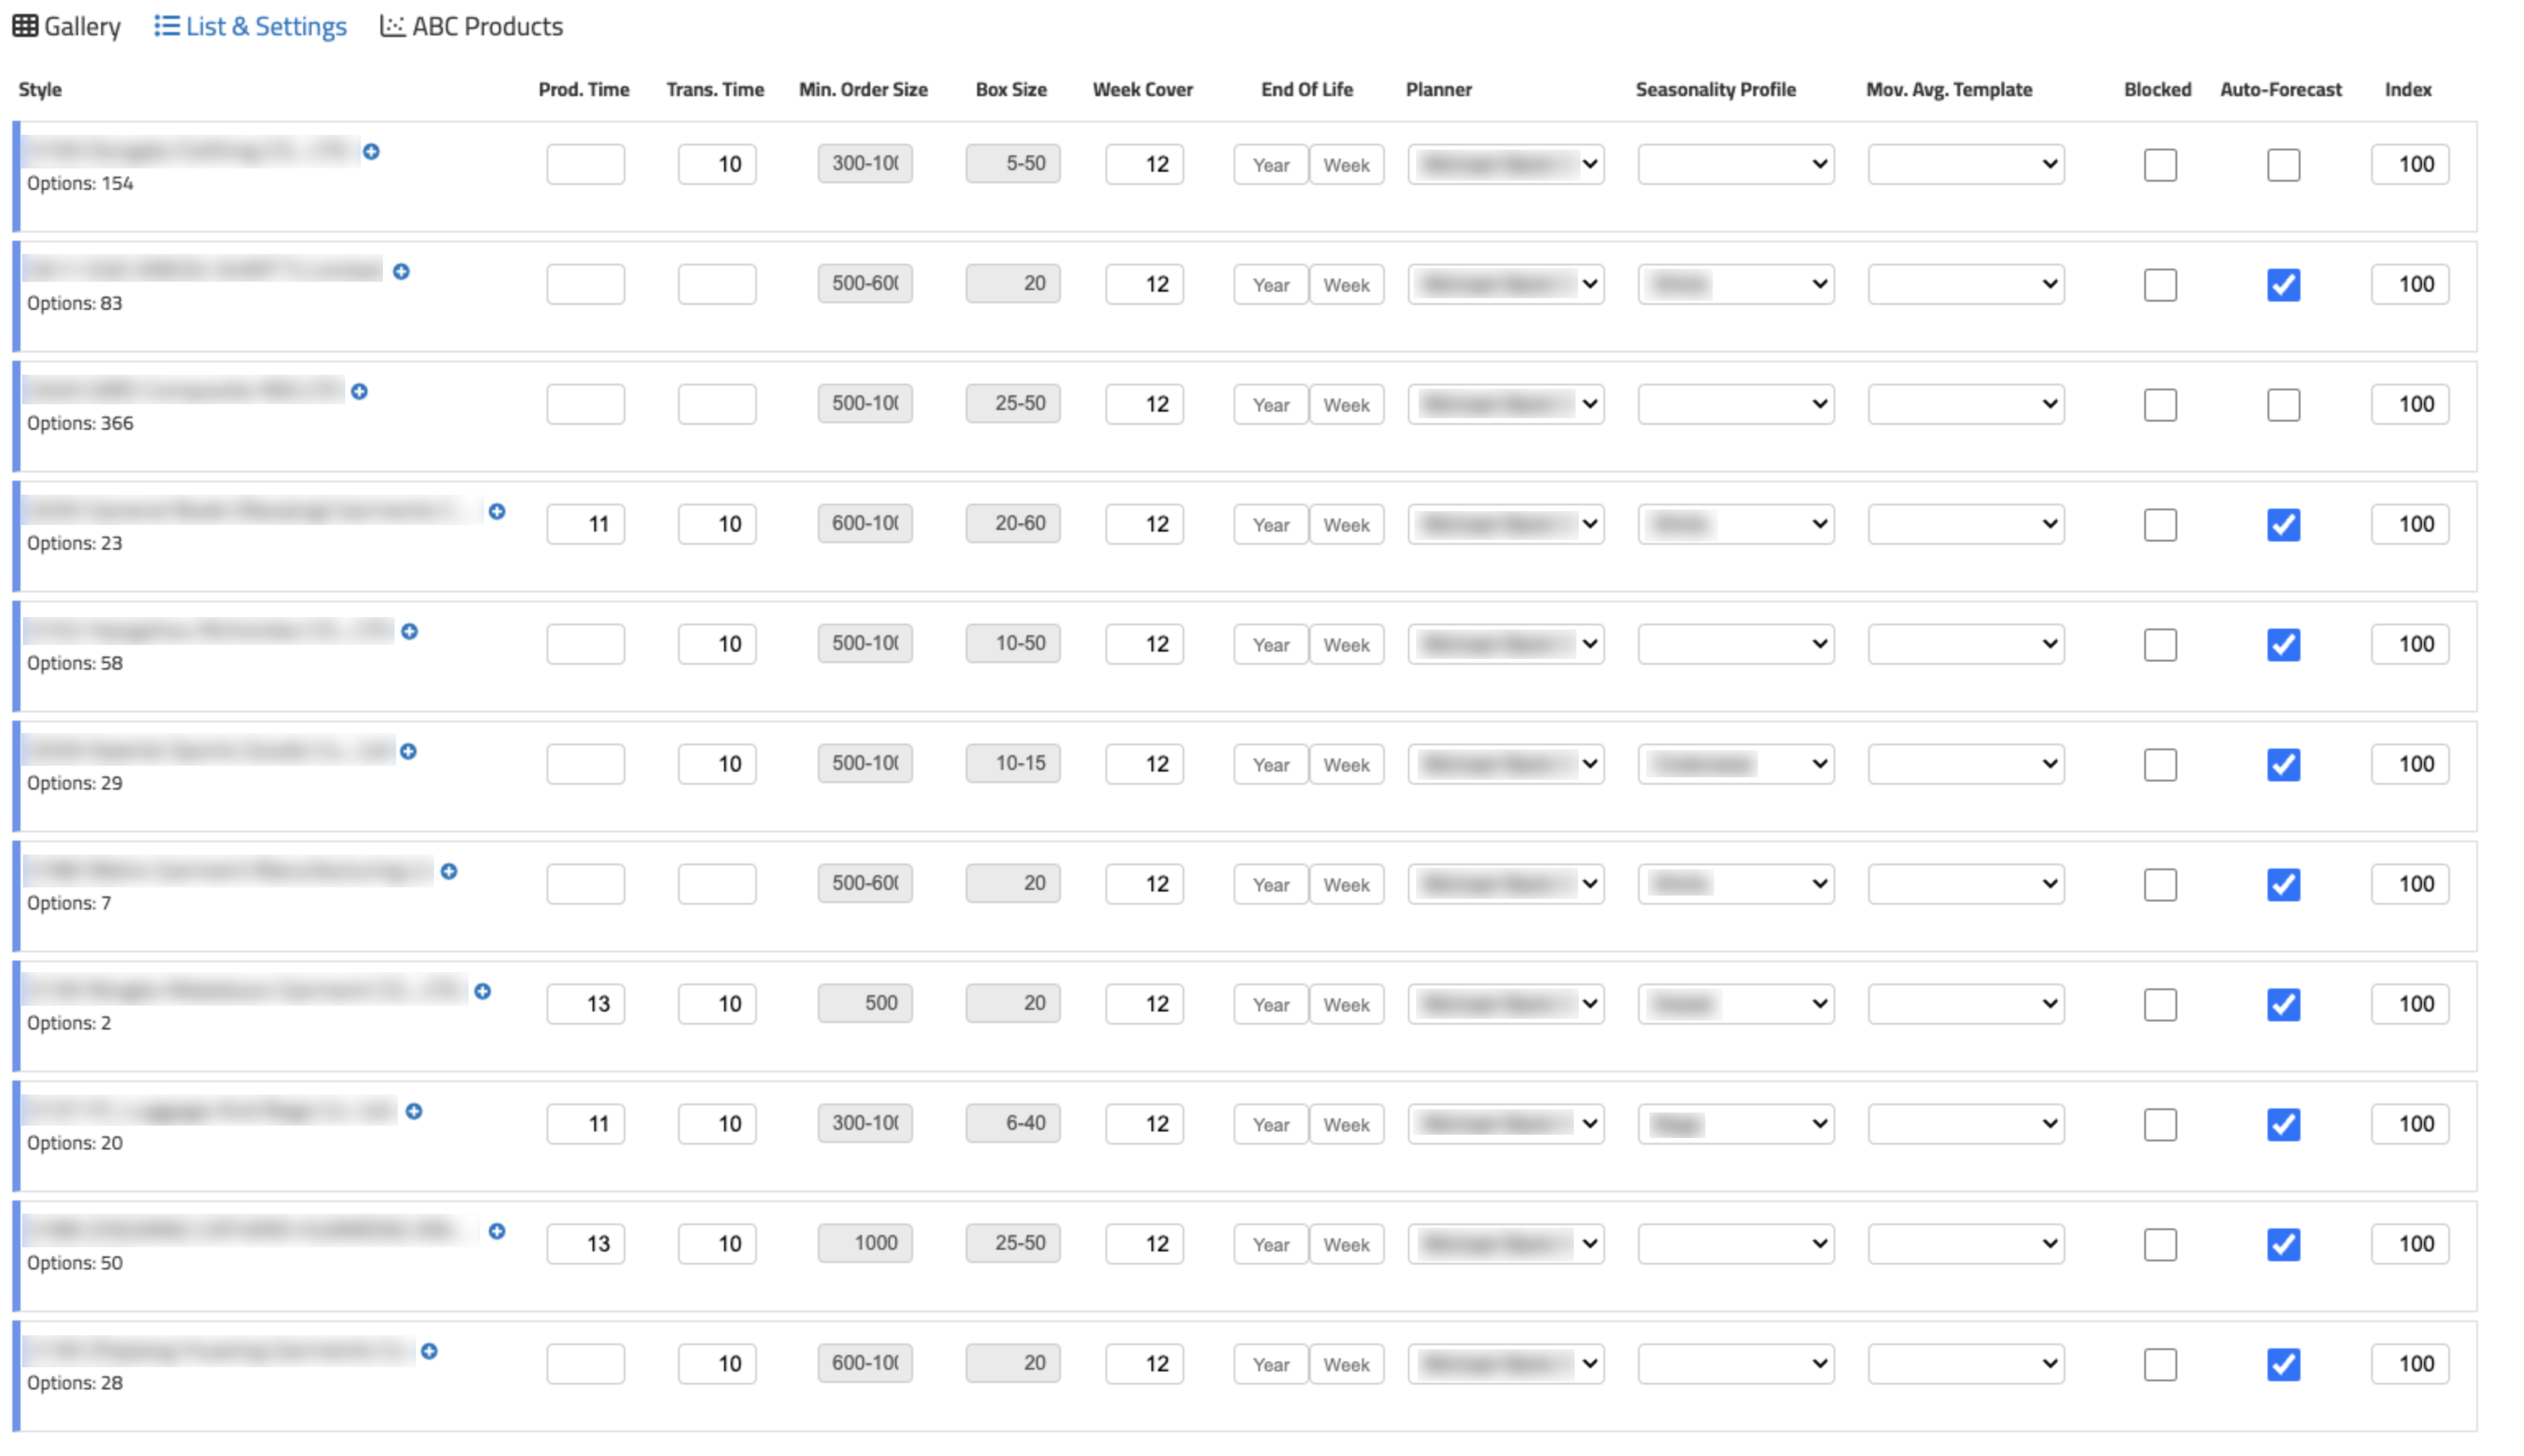
You can now edit master data at the following levels: Vendor, Master, Color, and Size levels. Corrections are reflected in all styles below the selected level.
It is possible to change Production Weeks, Transportation Weeks, Minimum Order Quantity, Box Size, Week Cover, End Of Life, Planner, Seasonality Profile, Moving Average Template, Planning Profile and Index as well as to choose whether the supplier should be Blocked and whether to Use Auto Forecast.
You will find the overview by selecting ‘List & Settings’ under ‘All styles’.
03 OVERVIEW AT STYLEMASTER LEVEL
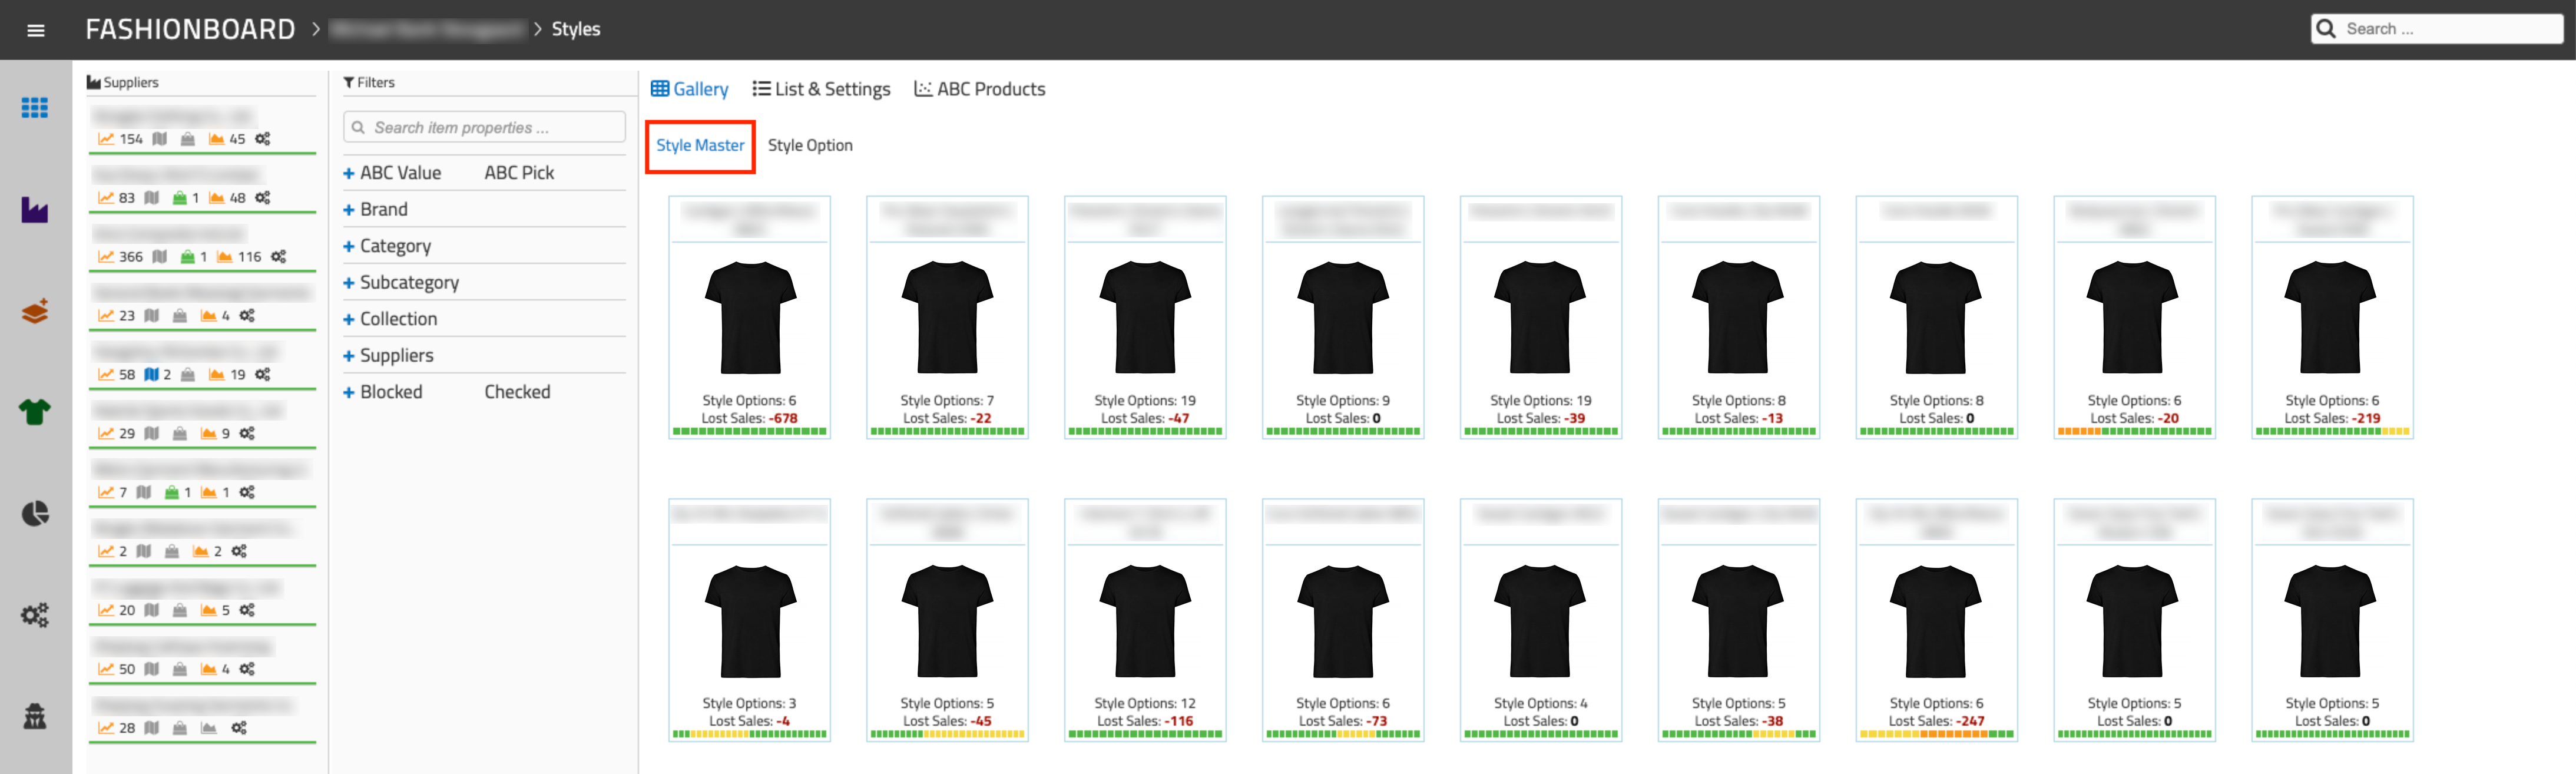
Under ‘All Styles’ it is possible to get an overview at Style Master level. It allows for a quick overview of underlying Style Options. You can see the number of styles, weighted availability, purchase suggestions and Lost Sales on the Style Master.
When selecting a Style Master, the Style Options that are below the selected Style Master are displayed.
It allows for an overview per Style Master. If you press one of these Style Options, you will only review the Style Options that are subject to the selected Style Master. In this case, style 1 out of 6 is displayed.
04 Style Master data
In addition to the data that has always been, we have added Fabric Consumption, Assortment Split, ABC Classification, Customers, Potential Lost Sales (If there is one), Retail Price and Wholesale Price. Most numbers show the given value, while you can edit the Assortment Split settings by pressing the blue gear (See section 12 for more information about Assortment Split). Please note that Assortment Split is only visible for products with multiple sizes.
If there is a green star next to First Arrival, it means that it is a new product.
By pressing the blue gear, it has become possible to control Consumption, Min. Order Size and Box Size all the way down to size/EAN level.
05 Weighted Availability
It is possible to use weighted availability, where all sizes are not weighted equally. Previously, all sizes for a style were weighted equally. Weighted Availability is weighted according to how much each size sells.
As seen below, Availability in weeks 6 and 7 is only affected by 2% corresponding to the Size Split for the sold-out size 4XL.
Weighted availability kan til- og fravælges. Det gør I under ’Admin – Settings – Other Settings’. Sæt et flueben i boksen Use Weighted Availability for at slå det til. Weighted availability er som standard slået til.
06 Auto Forecast
It is possible to choose that FashionBoard automatically uses the forecast from Moving Average / Moving Average without stockouts. The forecast is automatically added daily for reporting and purchase proposals.
Tap the little gear next to Mov. Avg. – 52 weeks to open the settings and turn off in Apply auto forecast. Here you can choose whether FashionBoard should take stockout periods into account (More about Stockout Periods in section 13).
In addition, it is possible to set an index for the forecast. If you set the index to be 70, the forecast will be adjusted down to index 70 before it is added.
07 DOuble ABC-classification
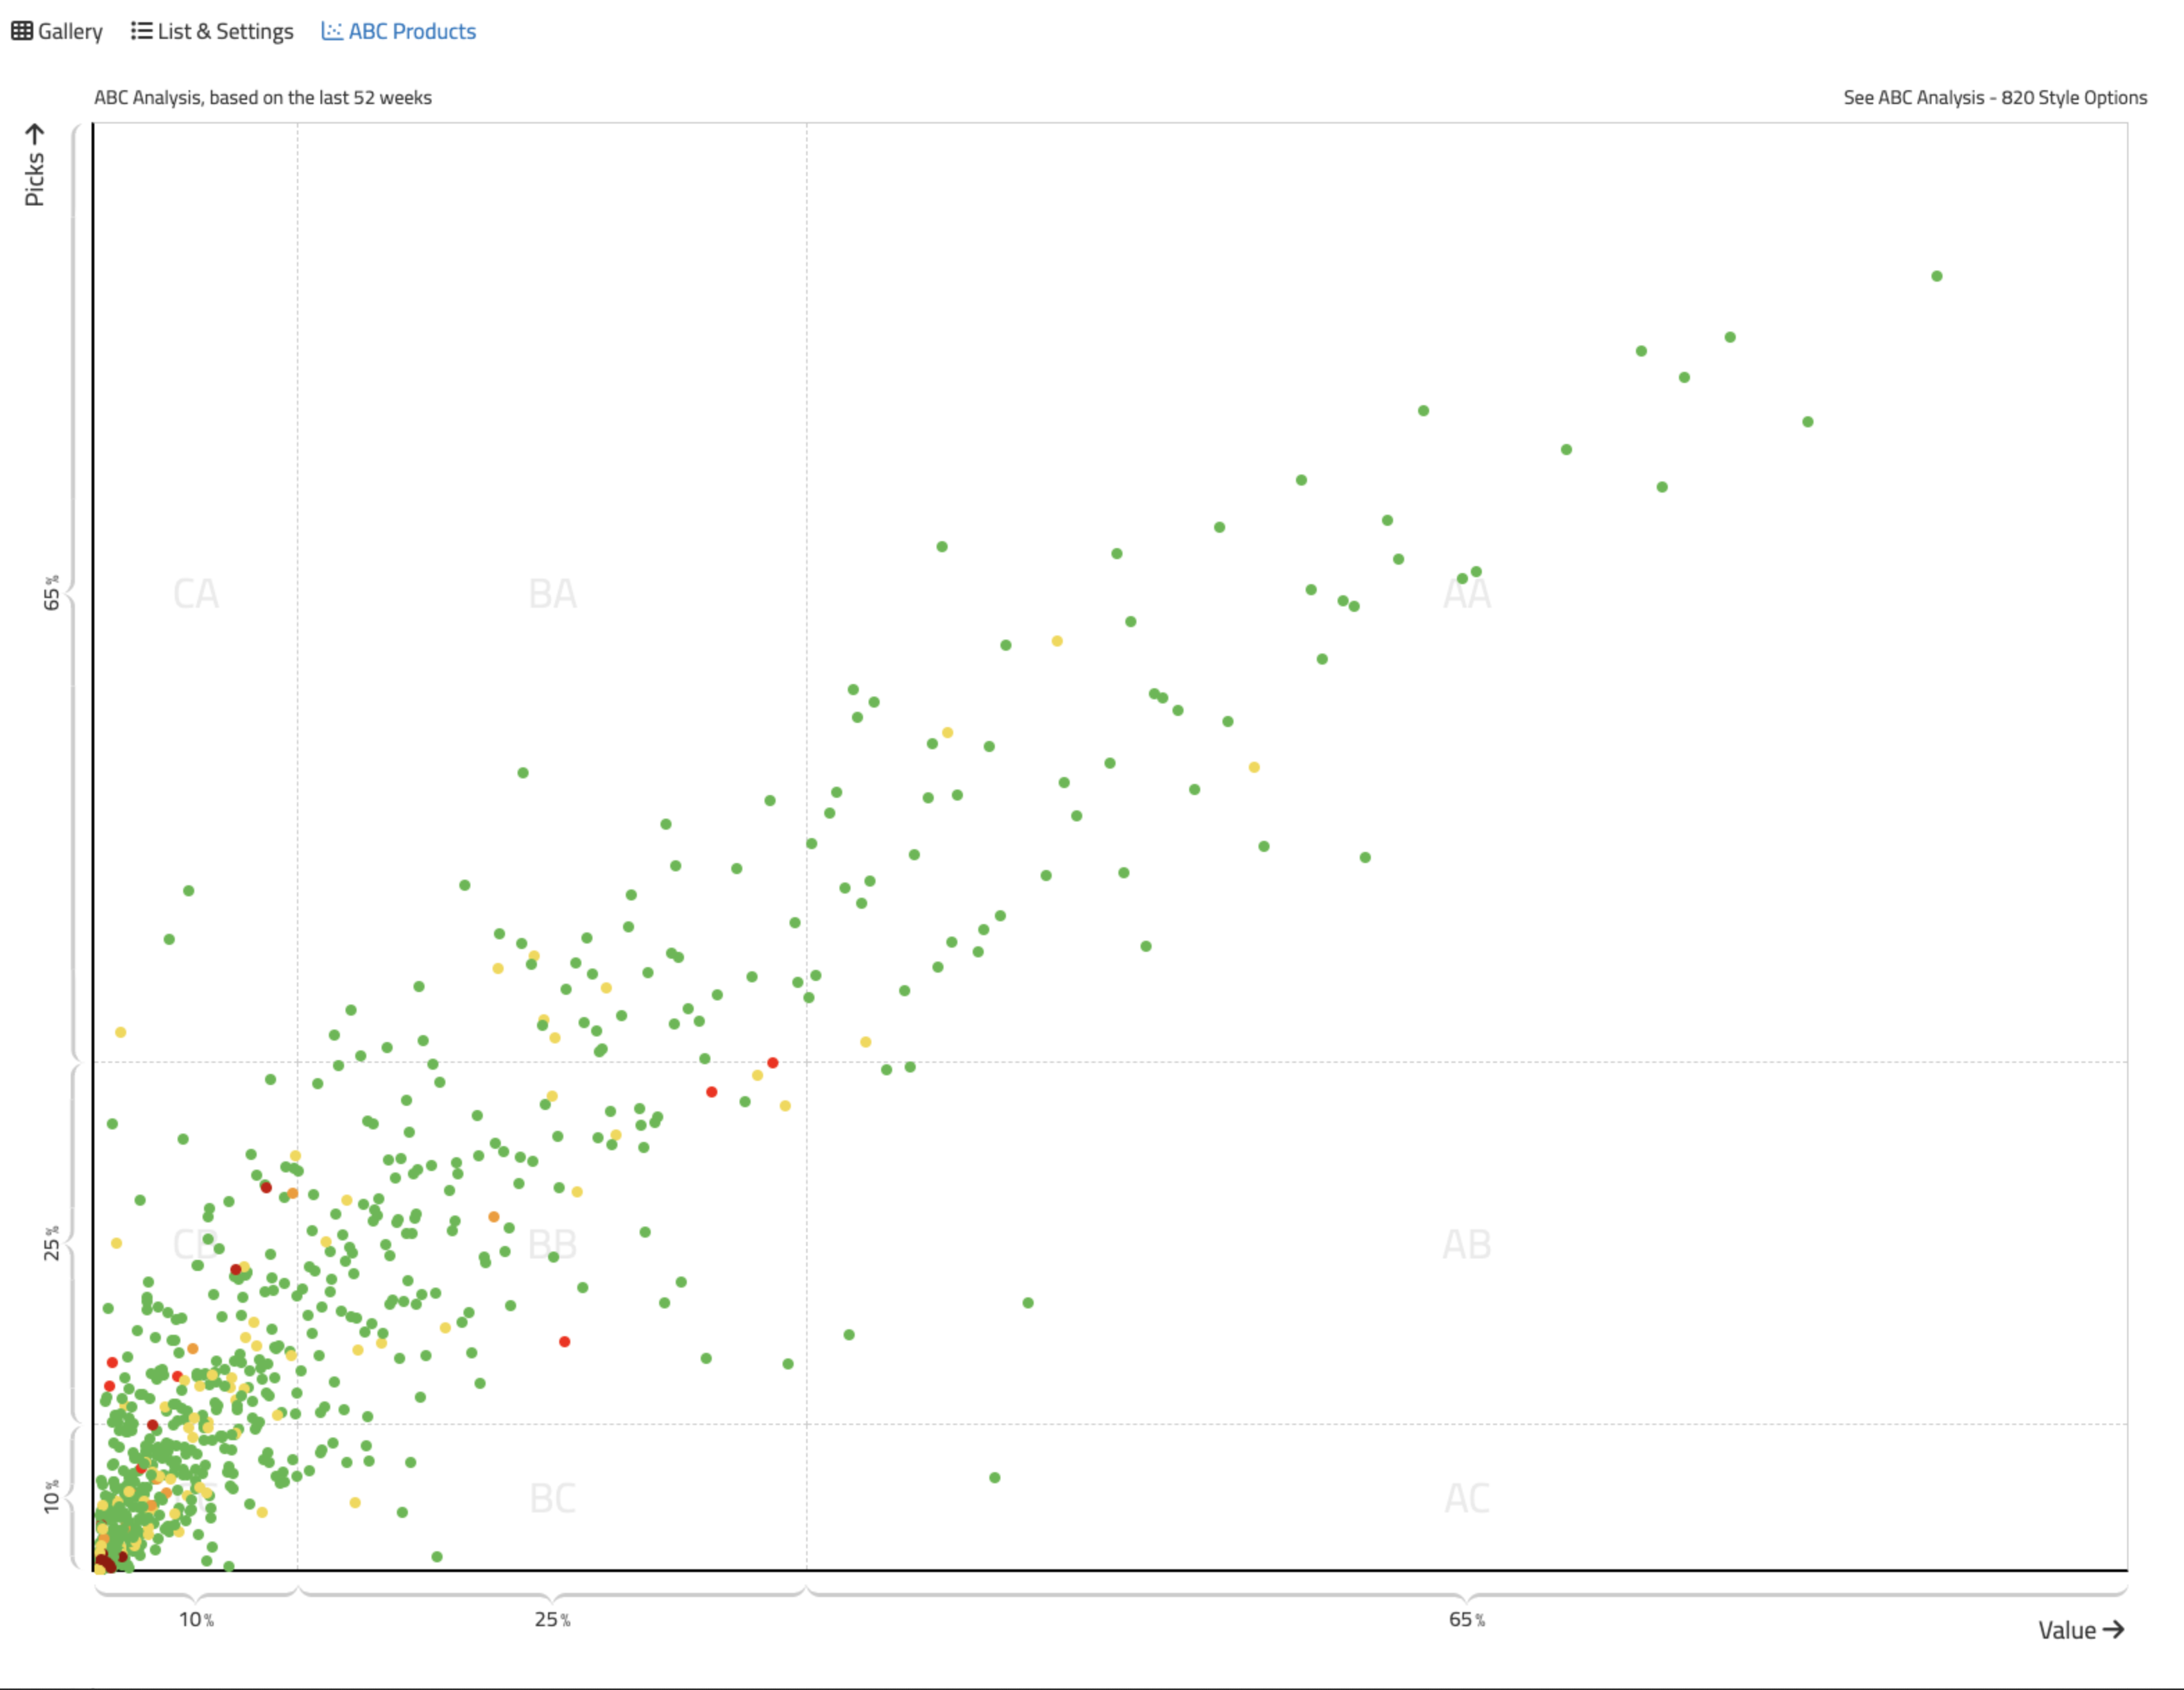
The double ABC-classification visualizes all styles by number of picks and value (a measure of revenue).
A double ABC-classification takes all products and distributes them by turnover and number of picks. On the X axis, FashionBoard finds the products (starting from the most marketable) that together make up 65% of revenue. These products are your A-products. Then the subsequent products are taken, which make up 25% of the turnover. These are your B-products. The remaining products with the lowest turnover, which generate 10% of revenue, are your C-products. On the y-axis, the products are distributed according to the number of picks.
The classification clarifies products that have many picks and at the same time have a high value (AA products) – and which are therefore best to spend energy on. Conversely, it also visualizes the products that sell worst and have the lowest earnings (the CC products), but which often take up a lot of time and typically take up proportionally much space in the warehouse.
The ABC classification can thus be used to lay out different planning strategies for different ABC groupings. This is supported, among other things, by setting up different Week Covers for how quickly FashionBoard should react to missing items, etc. at e.g. ABC-classification level (See how in section 10 on Planning Profiles).
Below is the double ABC classification graph with the single style represented by a dot. The style’s availability is marked by the dot color (Green to red for high to low availability, respectively). The ABC classification shows all styles across all planners.
Hover your mouse over a dot and see the style in question as well as the most important data. In the upper left corner is the ABC rating. In addition, name, image, EAN and availability are seen. The figures show Lost Sales (450 pcs.), Customers (255 pcs.), Style Revenue (500,411 DKK) and Sales Quantity (2,185 pcs.). At the bottom is Order Suggestion and Adjust Forecast Suggestion, which you already know.
You can choose an area in the ABC that you only want to see. For example, it could be all the CC products. Here you press anywhere within the CC area. You will now see all the CC products and their exact location. In addition, you have the option to use the filter on the left side to see specific product groups. Select the combination you want to see under ABC Value/ABC Pick. Below is zoomed in on the CC products.
ABC analysis
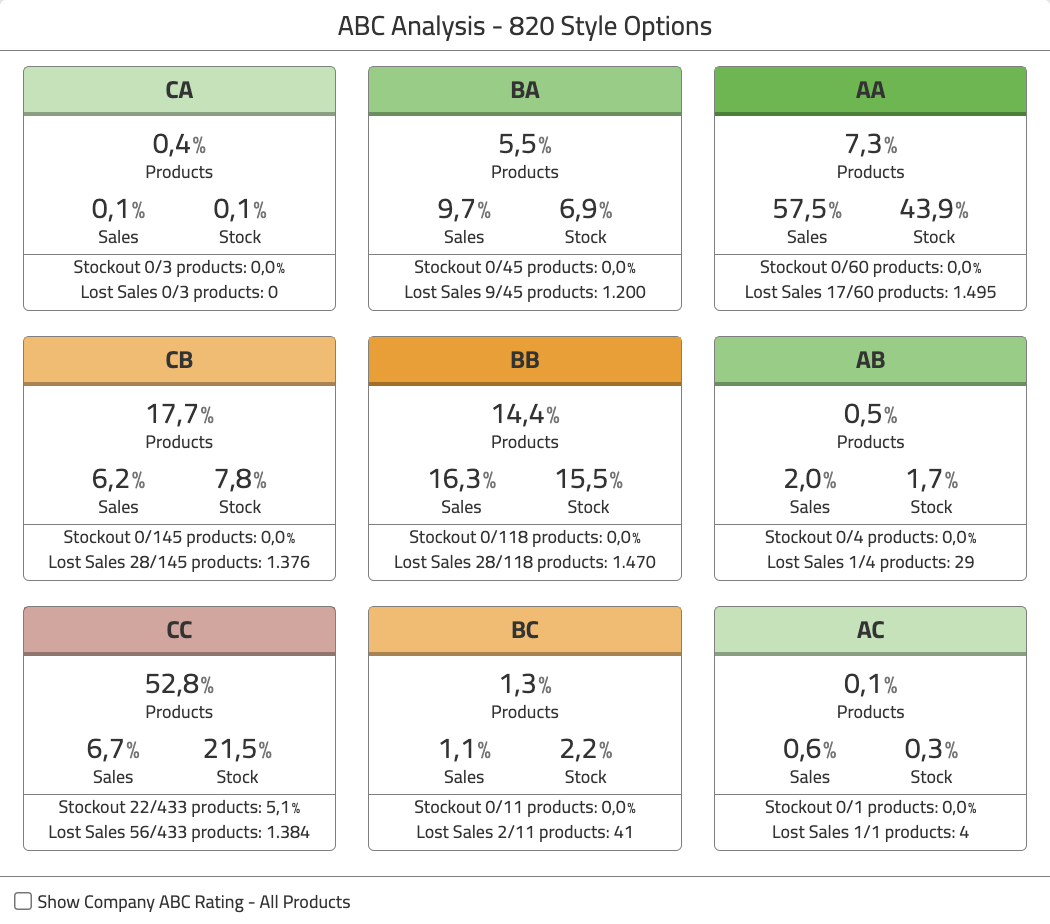
Above the ABC, you can press See ABC Analysis to see the ABC analysis.
Here you get an overview of how the selected planner’s styles are distributed in relation to all styles. It gives an insight into how much revenue and how much storage space each classification stands for and occupies. Under each classification are Stockouts and Lost sales for all products herein. Note that Stockouts are current, while Lost Sales are forward-looking.
The ABC analysis shows the selected planner’s products. By winging off in Show Company ABC Rating – All Products, the selected planner’s data is displayed on the left, and the entire company’s data on the right.
ABC settings
The settings options for the ABC classification can be found in the menu under ‘Admin – Settings – ABC Classification’.
Here it is possible to set how the ABC classification is distributed percentage-wise, as well as how many weeks the calculation is based on. The calculations are made retrospectively but based on today’s date. Note that corrections to ABC settings will not take effect until the next day, as it requires a complete update of the data.
08 moving average template
Moving Average Template allows you to save a template across styles. If you subsequently correct it, it changes for all styles that use this template.
Moving Average Templates average the history of the specified weeks and are based on each week. A Moving Average Template is made under ‘Settings – Moving Average Templates’. When a new template is added, the desired settings are set for the given template.
09 seasonality profiles
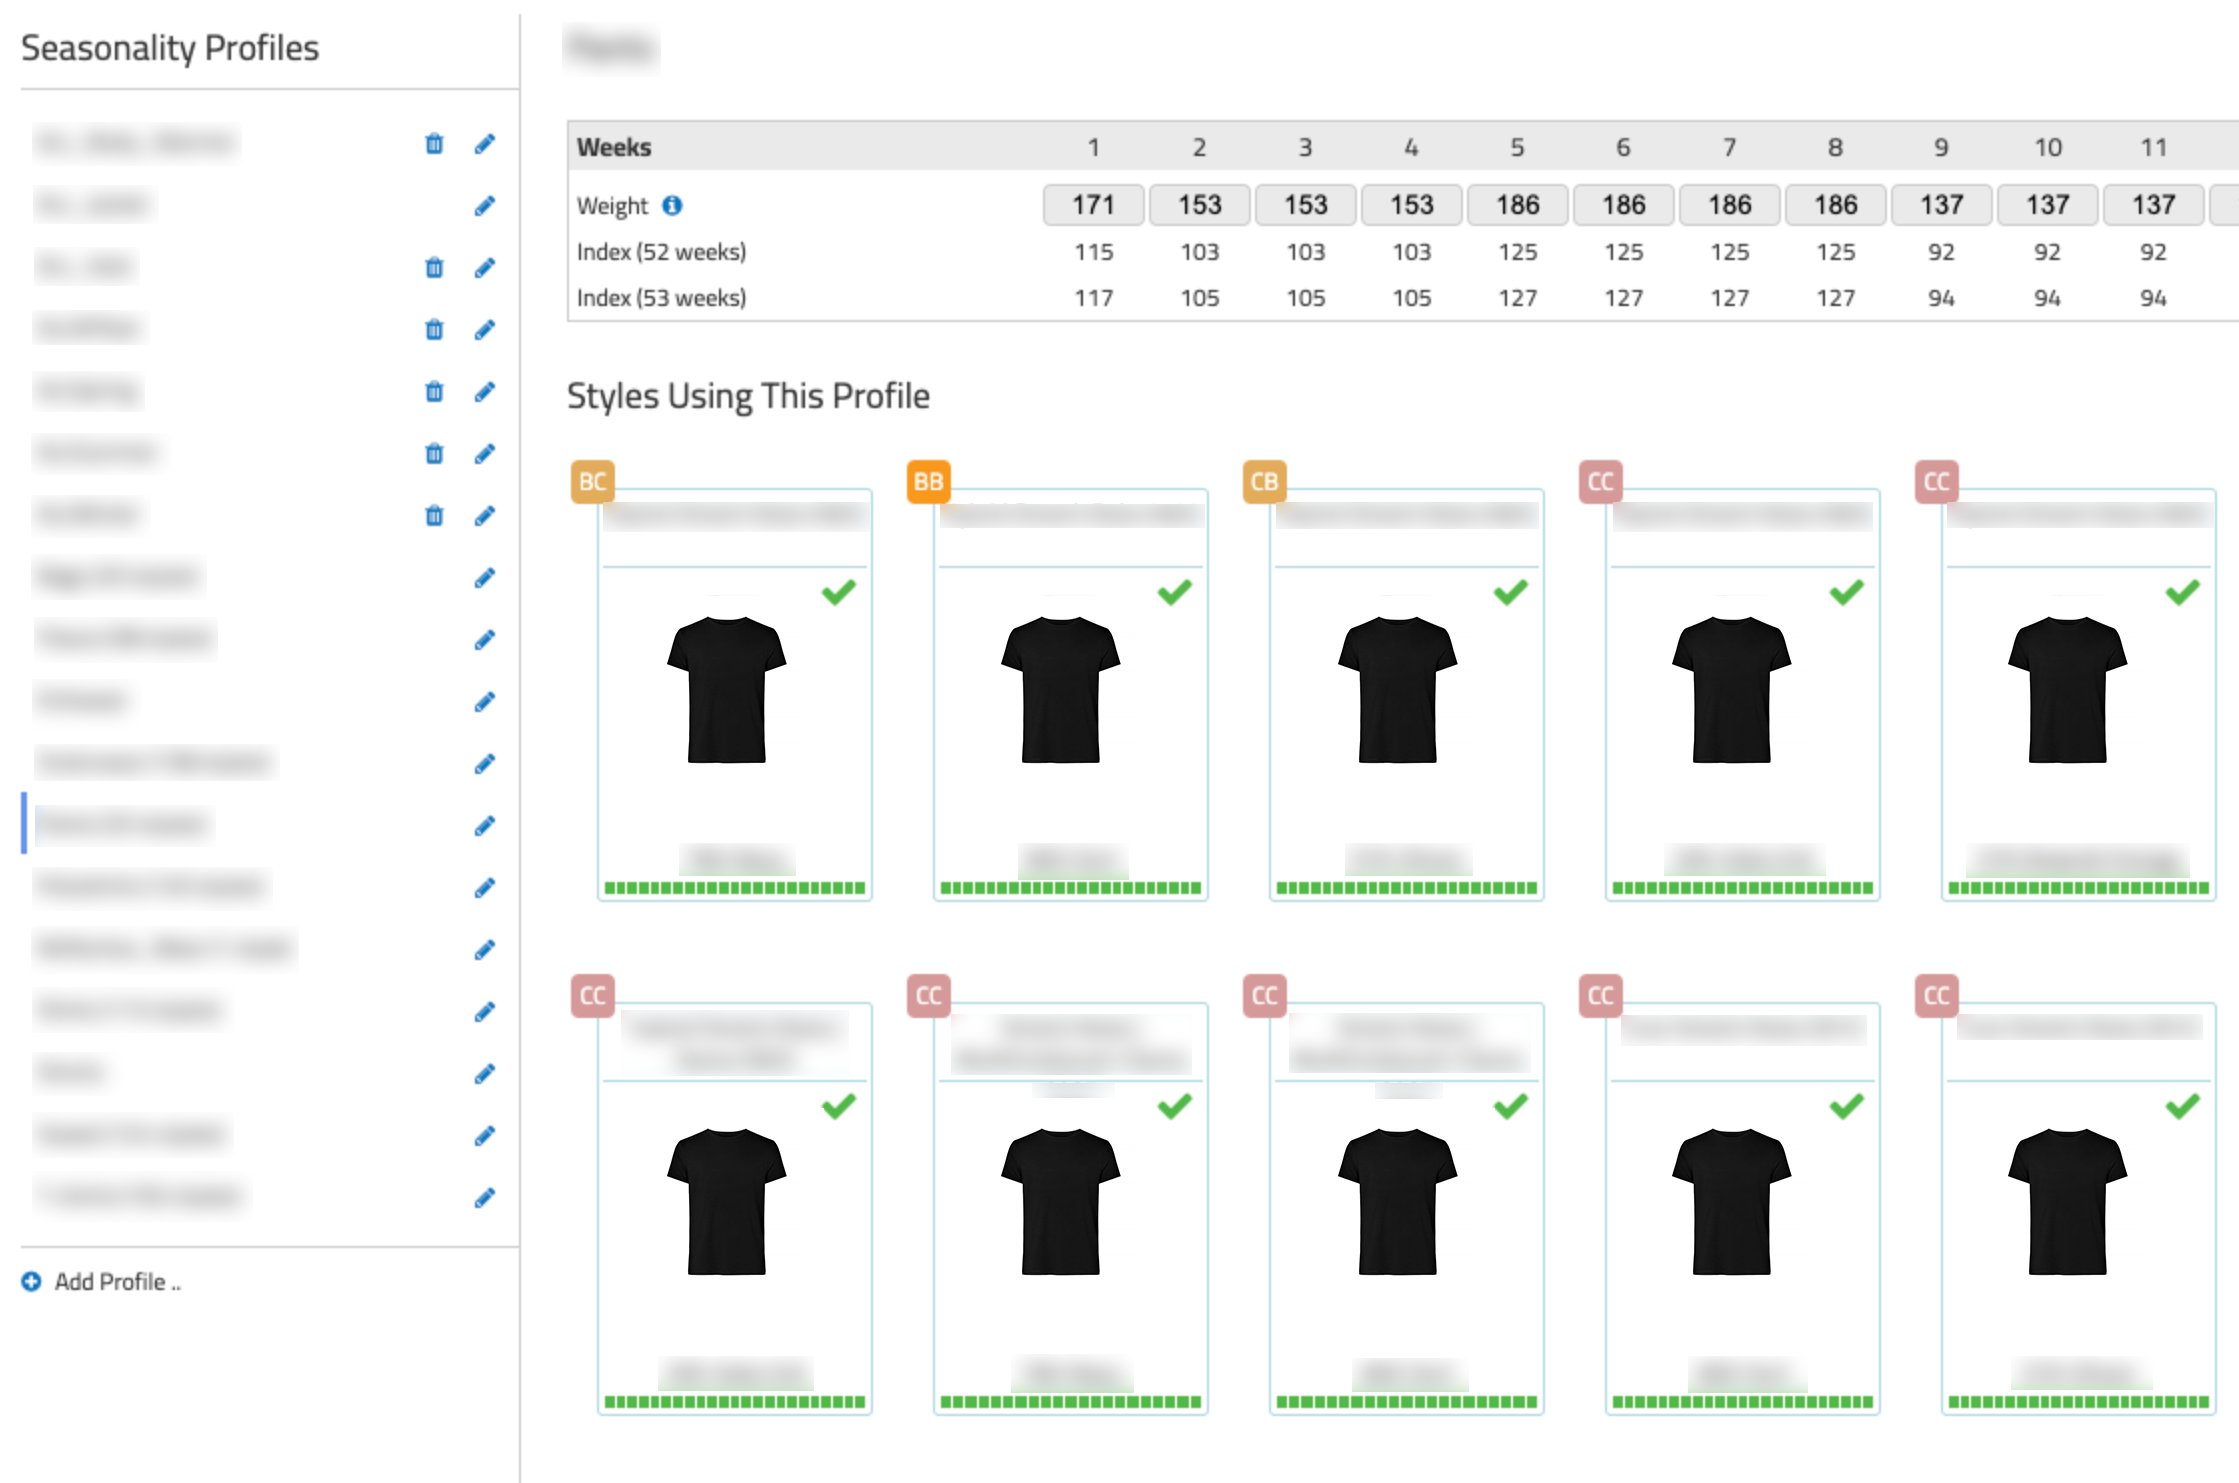
With Seasonality Profiles, it is possible to give more weight to specific styles during periods when they sell more. For example, it could be rainwear that sells significantly more in the autumn season compared to the rest of the year. The profiles can be viewed, added and edited in the menu under ‘Settings – Seasonalilty Profiles’.
Click on the name itself to see the content for an existing seasonal profile or click at the bottom to add a new one.
If the profile is prepared in Excel (possibly based on the cubes), the profile can subsequently be copied in from Excel. A profile can be specified for 52 and 53 weeks, respectively.
10 planning profiles
Planning Profiles contain settings that affect procurement proposals. The scheduling profiles can be assigned to desired products.
You can view, create and edit the planning profiles under ‘Settings – Planning Profiles’.
On the planning profile, the Week Cover, Minimum Box Ratio and Minimum Order Ratio are set. The values for the Minimum Box Ratio and Minimum Order Ratio are written as commas. In the example below, the numbers mean that if 50% is missing from a box, FashionBoard will suggest ordering a new box home. The value of 0.25 in the Minimum Order Ratio means that if 25% of a product is missing, FashionBoard suggests ordering the minimum amount.
If one of the three fields Week Cover, Minimum Box Ratio and Minimum Order Ratio is not filled in, it will always fall back on the general settings made under ‘Admin – Settings – Other Settings’. Once a Planning Profile is created, it can be assigned on a Style Option by editing the style master data and assigning the desired Planning Profile.
Automatic removal of Lost Sales will automatically reduce the forecast when there is no stock on the product. This feature should only be applied to products that have only one size.
You can add Planning Profiles under Master Data on the product, or via mass editing on all styles.
11 Fabrics Excel Export
It is possible to export the Fabrics list to Excel to facilitate communication with the supplier.
12 assortment split (SIZE SPLIT)
In addition to Actual and Manual split, two new types of Assortment Split have been added, both of which take stockouts into account: Style Master Split and Style Option Split.
The inventory and the selected Assortment Split can be viewed on the Stock tab. In the image below, Assortment Split ‘Actual’ is selected.
For each style, you can choose which split to use by pressing the sprocket next to Assortment Split in Style Master Data. Please note that Assortment Split is only visible for products with multiple sizes.
Assortment Split is generally calculated at 52 weeks. It can be changed under ‘Admin – Settings – Planning Profiles – Size split Weeks’ if desired.
Assortment Split shows the split for the different split types. At the top, select the split type you want to use. At the bottom of the screen you can see how many days of full Assortment the Style Option split is based on.
By selecting Master, the forecast is based on all Style Options in the Style Master based on the days when the individual options have had full stock. The Master Split can be used with advantage when introducing a new color, where you have previously been forced to use Manual Split.
If you choose Option, the forecast is based on Style Option based on the days you have had a full range and thus takes stockouts into account. This option is typically the one that provides the most accurate forecast on Style Options already in FashionBoard.
By choosing Actual, the forecast is based on the actual sales, and therefore does not take stockouts into account. Actual Split also includes future/open orders in the calculation.
If you choose Option Split and the period of full storage becomes too low (25% of the period) a warning will appear in the planning image.
13 stockout periods
In the planning image, a Stockouts tab has been added. Here you can see which periods we believe the style has been sold out. The number in parentheses on the tab indicates what percentage of the given time this Style Option has been sold out – in this case 31% in 52 weeks.
The total calculation for the Stockout period is weighted according to the size split of the sizes. In the detail view, it is possible to see exactly when the individual sizes have been sold out at the bottom.
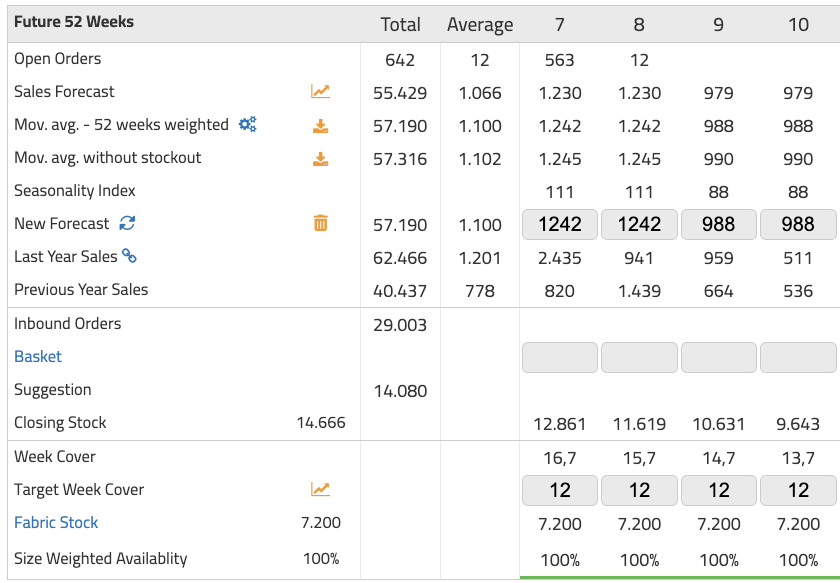
14 moving average without stockouts
The Moving Average without stockouts forecast includes what you could have sold if the product had not been sold out during the period. It gives a more accurate picture of what you can expect to sell when you have all sizes in stock again.
Mov. Avg. without stockout looks at what you could have sold if had had all sizes in stock. As seen in the example below, there can be a relatively big difference between Moving Average if you take stockouts into account compared to if you don’t.
By taking stockouts into account, you don’t have to eliminate weeks because you’ve been sold out.
15 outliers
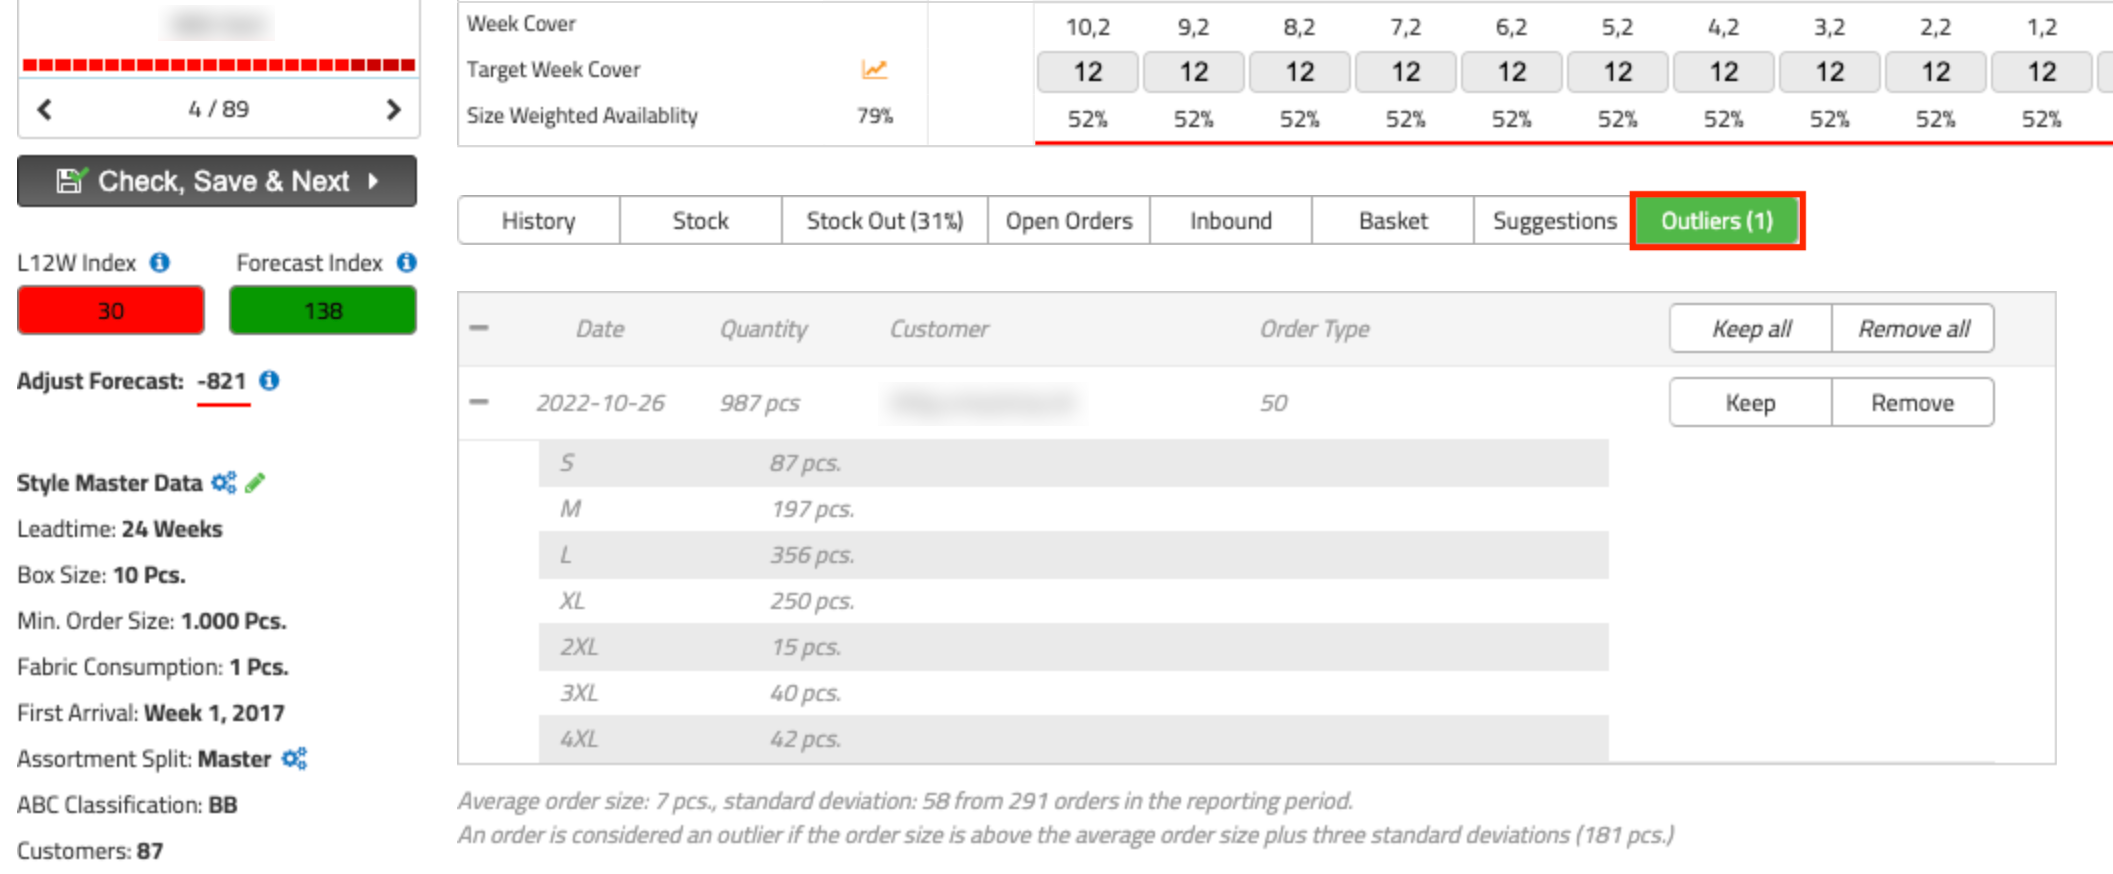
With the implementation of Outliers, it is possible to disregard individual orders that have been unusually large, and therefore should not be considered as representative history of the style. Outliers are added as a tab and are seen at the Style Option level.
The list of Outliers includes details such as date, name, and quantity. In dialogue with the seller, you can choose whether to keep the order in the forecast or not.
An order is referred to as an Outlier if it is significantly larger than average. The exact calculation can be viewed in the tab. You can influence the sensitivity of Outliers under ‘Admin – Settings – Other Settings’. If there are any Outliers you have not yet decided on, the tab will glow orange to indicate that you need to decide on it. By default, an Outlier will count until it is decided.
By deciding on Outliers, you do not have to eliminate weeks where there have been extraordinarily large sales.
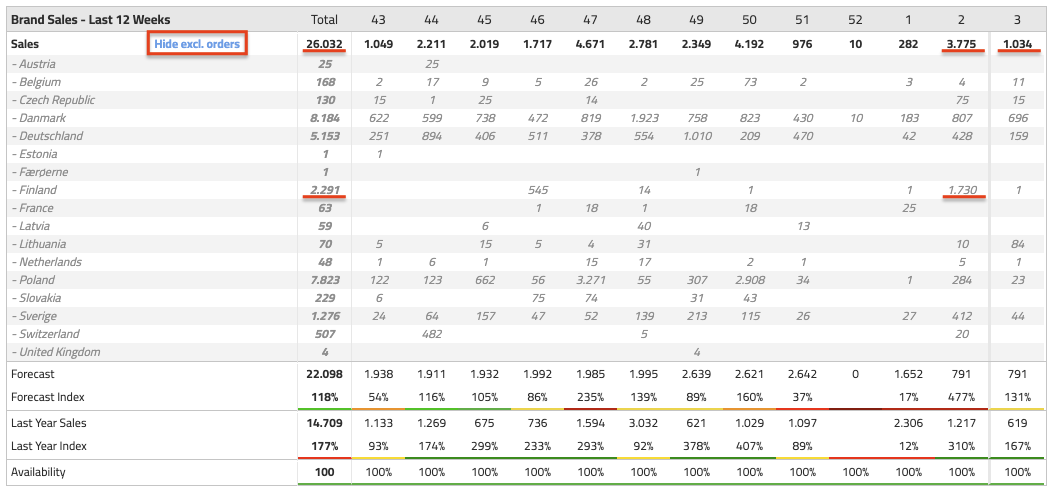
If one or more orders are removed from the forecast, it is possible to view the sales history with and without the deselected orders by clicking hide excl. Orders/Show Sales.
16 pre-sales
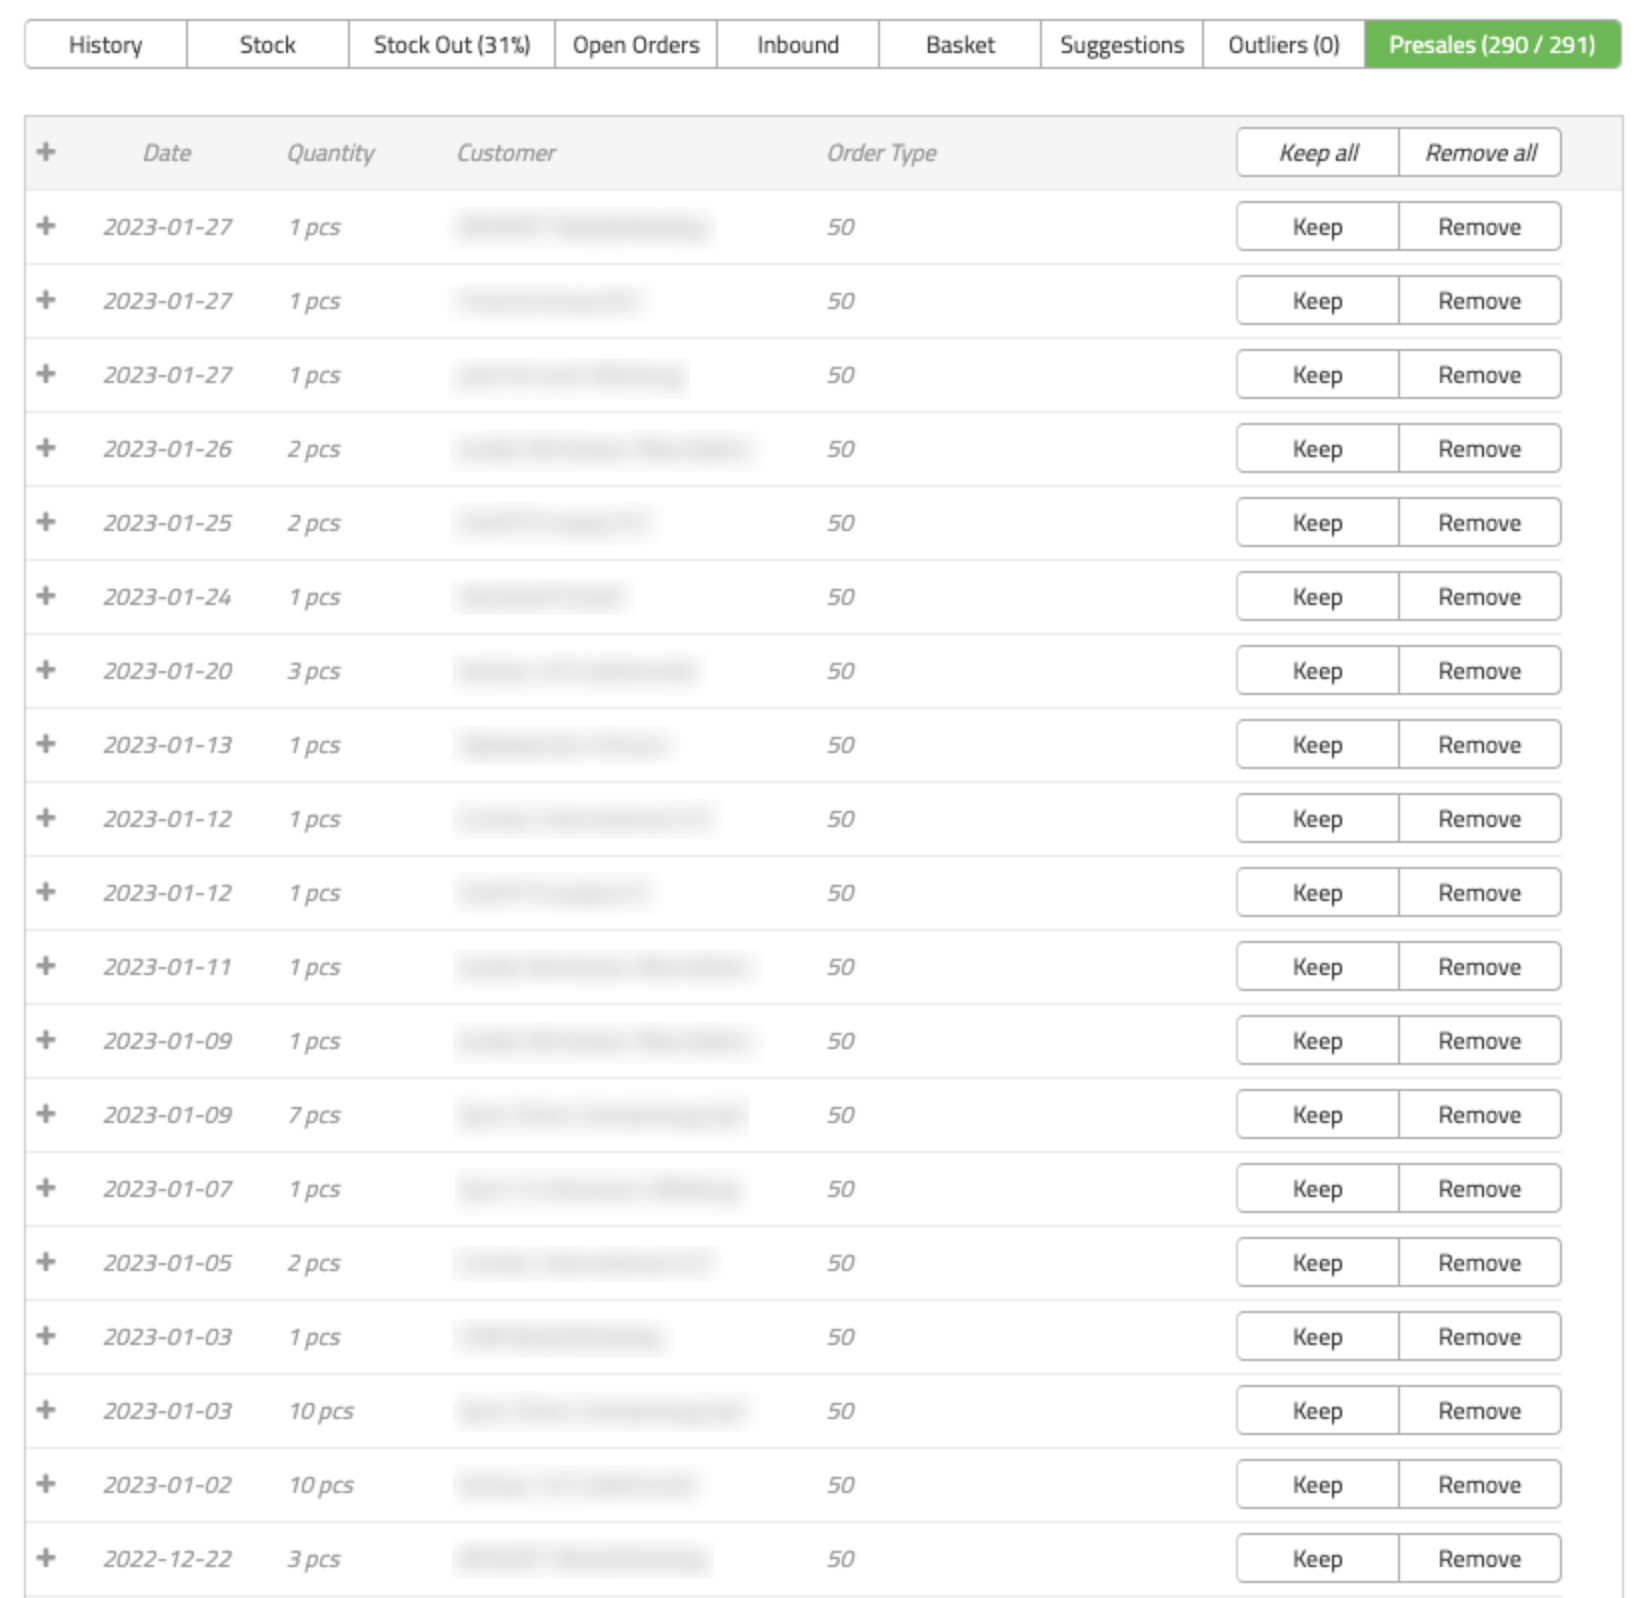
All Pre-sales are gathered in one tab and are gathered at Style Option level. This makes it easy to decide whether the specific Pre-sale should be kept in or removed from the forecast.
You can also set up so that Pre-sales are not counted in the forecast. This is done under ‘Admin – Settings – Other Settings’. If winged in this box, Pre-sale orders will not count towards the forecast, so they do not affect the Moving Average.
17 show/hide EAN on size level
It is now possible to see Size Split with SKU/EAN instead of the sizes as it has been until now. Switch to SKU/EAN view by pressing Size.
Switch back to the size view by pressing EAN.
18 basket details
The display of products in the basket looks a little different. We now group styles per Style Master.
In addition to the traditional view of the Size Split, you can switch to a more detailed view: a matrix with more information on the individual size. The button marked in red shows the matrix view.
19 basket excel export
It is possible to export all or part of the basket to Excel. The buttons marked in red allow you to export the entire basket, a Style Master or a single Style Option.
20 Basket: Split order
Once you have placed products in the basket, you can make an order from parts of the basket.
On the far right, a column has been added where you can wing off the products to be created on the same order. The search box can help you search for a specific word. For example, it could be ‘Bamboo’ if all products containing bamboo are to be created on the same order. A search keeps already selected orders so that the search can be used to add specific products to the existing order. Use the button in the upper right corner to create the order.
In addition, it is possible to save a basket for later use on the ‘Save Order’ button.
21 New section: Reports
In the new report section there has been added a Stock Analysis, which is an inventory analysis that shows the inventory value, last sale and Week Cover.
The second report Open Purchase Orders shows open purchase orders sorted according to the number of days to expected receipt, which can be used for follow-up on upcoming purchases. It is also possible to catch if you have placed a purchase on an item that already has a high Week Cover.
22 developments in active EANs
The settlement for the use of FashionBoard is based on the number of active EANs. You can follow the development of active EANs under ‘Admin – Active Products’.
The overview shows the development of EANs divided into Active, Blocked and Deleted EANs. In the same graph it is also possible to see the development of Style Masters and Style Options.
23 settings
A new item has been added under the menu item ‘Admin – Settings’. Here it is possible to set the settings for the ABC classification, Planning Profiles, Filter Text and Other Settings. We have previously covered the first two, and therefore do not go into depth with them here.
filter text
It has become possible to edit the text on filter labels. They can be changed under ‘Admin – Settings – Filter Text’. This can make sense in situations where you use a filter text for things like fittings. Here it is appropriate to change the text from Sub-Collection to Fit so that this text appears in e.g. filters.
other settings
Under Other Settings, there are various options.
If Use Weighted Availability is selected, weighted availability is displayed in all views of availability in FashionBoard.
Tick off ‘Show Pre-sale Tab’ if you want to watch Pre-sale at Style Options. It is also possible to FashionBoard automatically remove Pre-sales from the forecast by wing off the last box: Auto Remove Presale.
If you tick ‘Hide Forecast Suggestions’, Forecast Suggestions will no longer appear in the overview of all styles.
Put a value in ‘Highlight New Products’ that defines how many days a product should be considered new (and thus have a ‘new’ badge).
24 New filtering opportunities
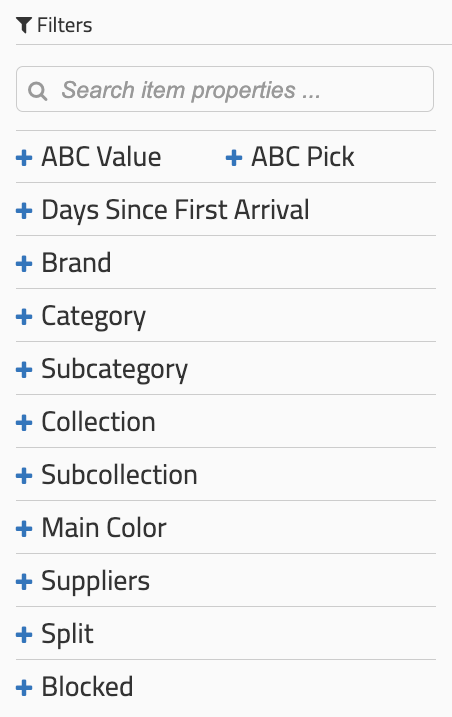
New parameters have been added to the filtering: ABC, Days since first arrival, Split, Blocked and Checked.
25 totals
In the planning image, the total column has been moved to the left side, so you do not have to scroll all the way to the right. In addition, an average column is added.
26 ADD OPEN ORDERS TO THE FORECAST
In the planning screen, it is possible to add open orders to the forecast. They added by pressing the button marked in red.
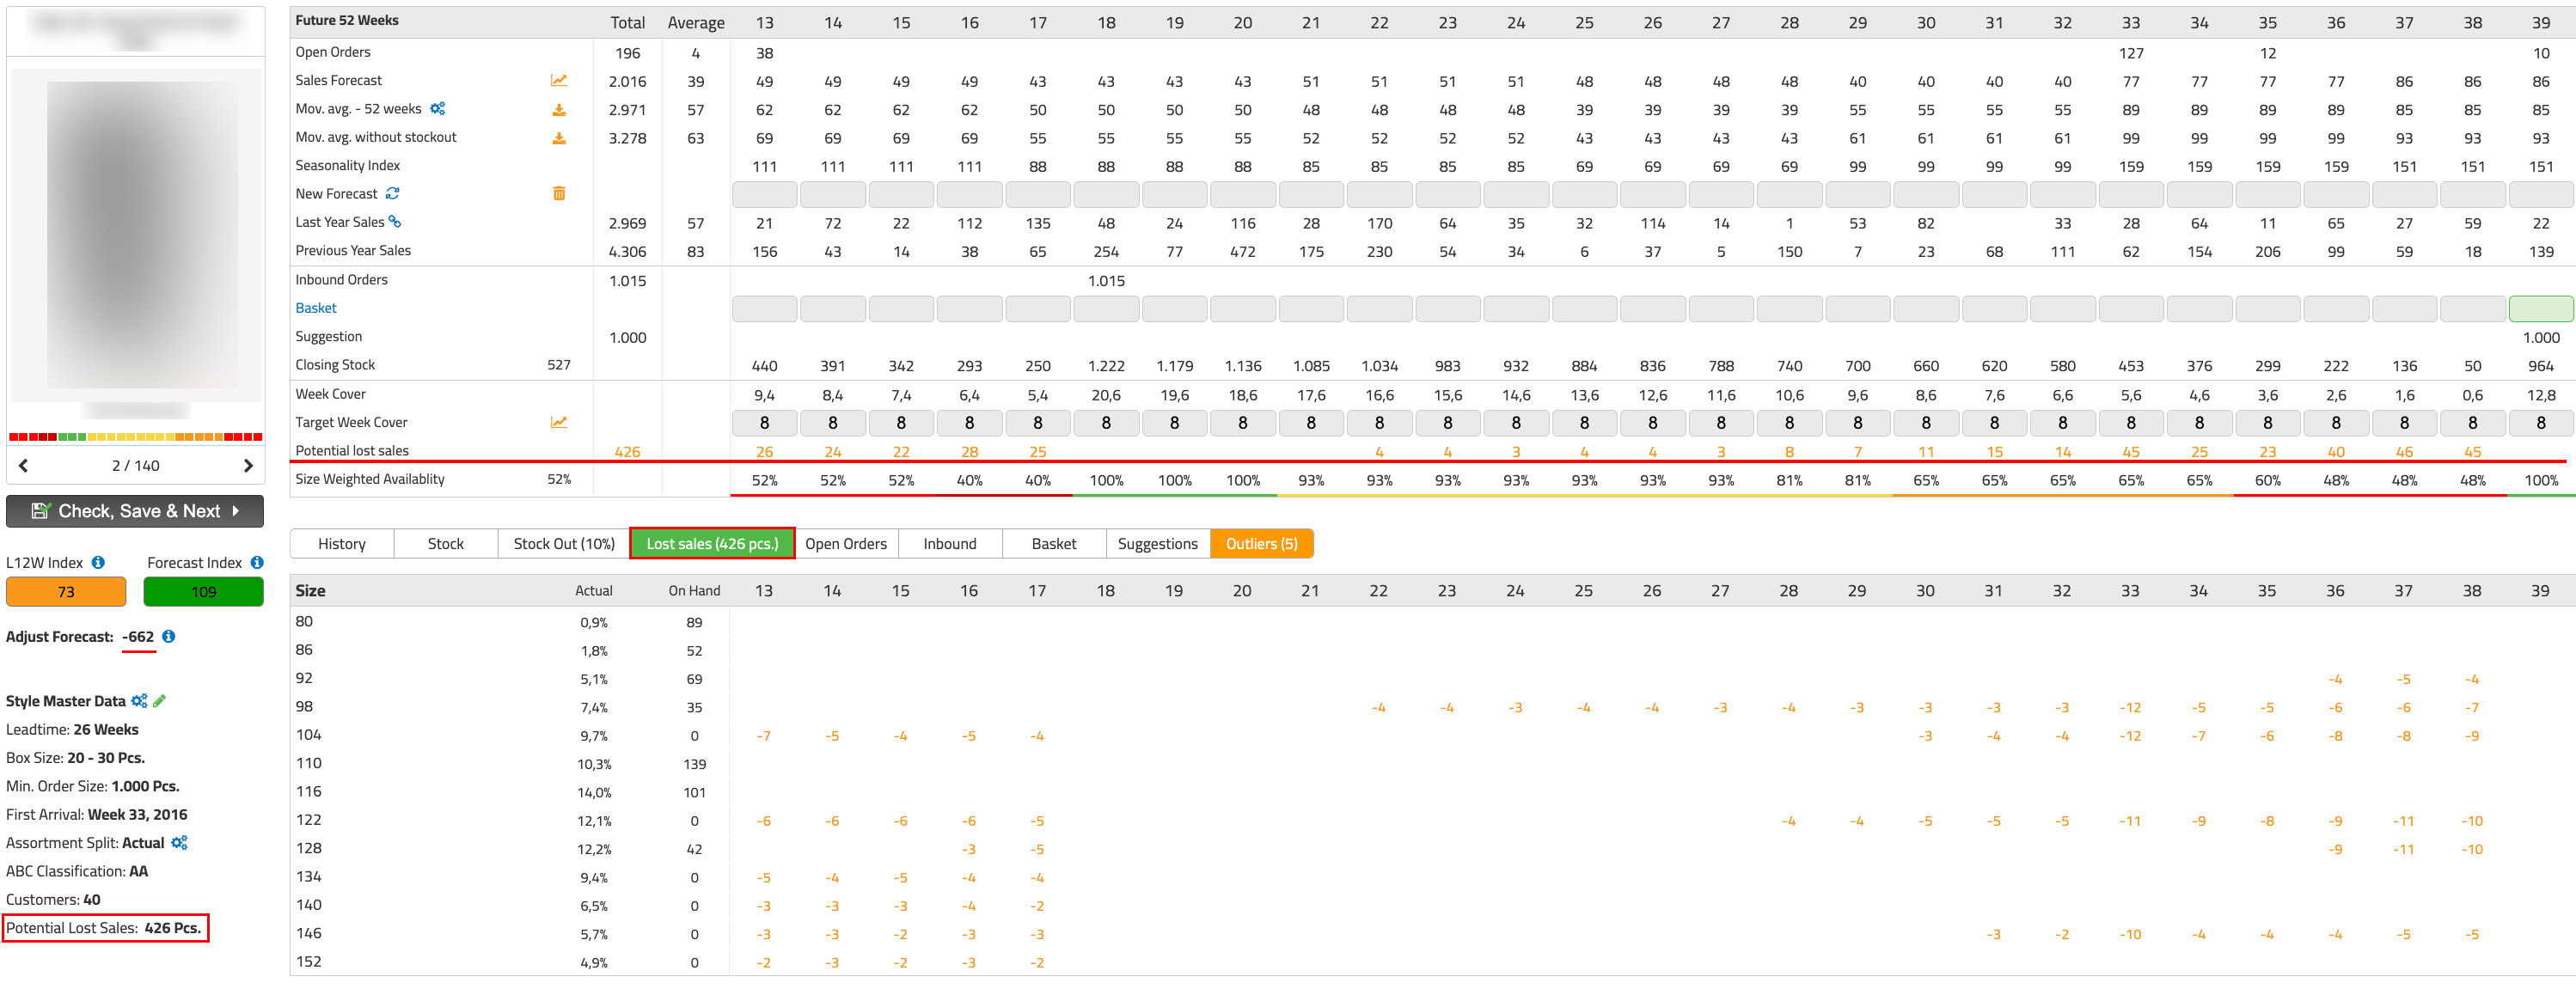
27 POTENTIAL LOST SALES IN PLANNING
Lost Sales can be seen below as a new line in the planning screen. The potential lost sale shows the quantity you cannot deliver based on inventory, forecast, and selected size split. Potential lost sales are calculated until the next possible delivery.
In the details section at the bottom, the tab shows the potential lost sales by size.
Under style master data, total potential lost sales across sizes are seen.
28 SALESDETAILS IN PLANNING
It is possible to tap on a weekly value in “Open orders” to see details about customers and order types. The details are sorted by order size with largest at the top.
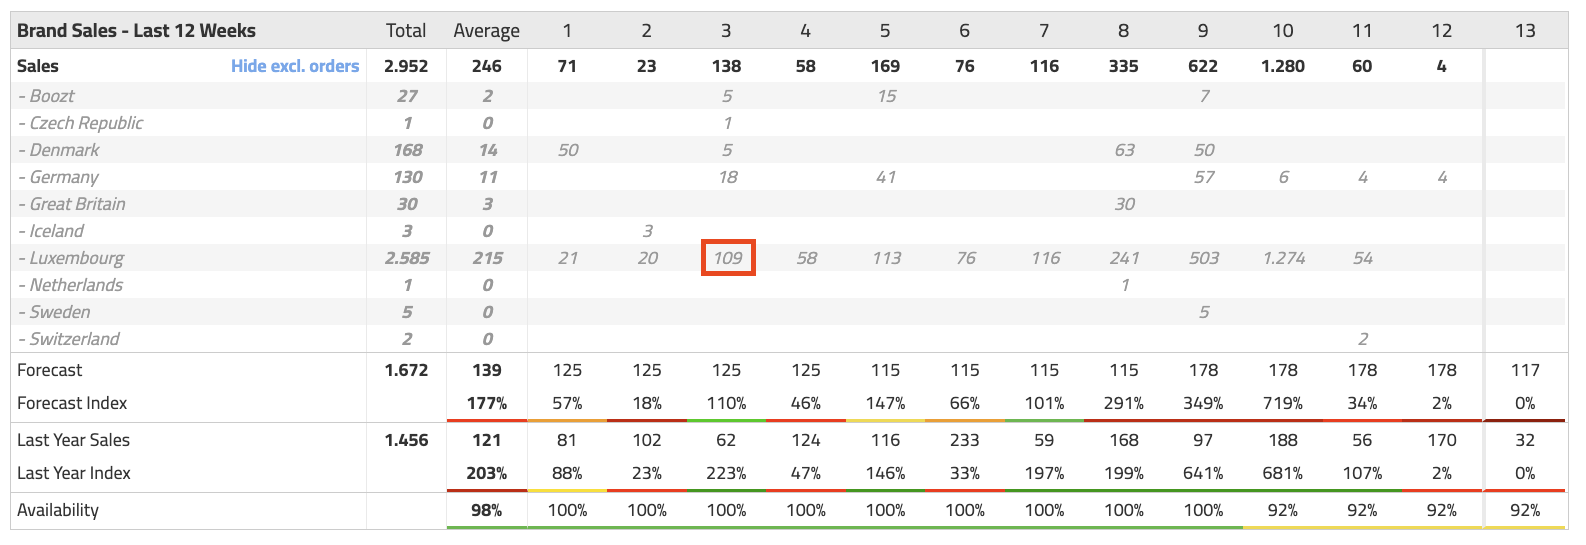
You can also see the sales details from the last 12 weeks of sales. Here you can tap on total for the week or on a value for a single brand/country to see the sales figures for that individual.
29 THREE NEW REPORTS
Three new reports have been added: Lost Sales, Open Purchase Orders, and Size Split Error.
Lost sales report
The report shows a comprehensive view of the company’s potential losses, across planners, within the products’ lead time.
The following delivery is a scheduled order, so you can quickly get an overview of whether new items have been ordered.
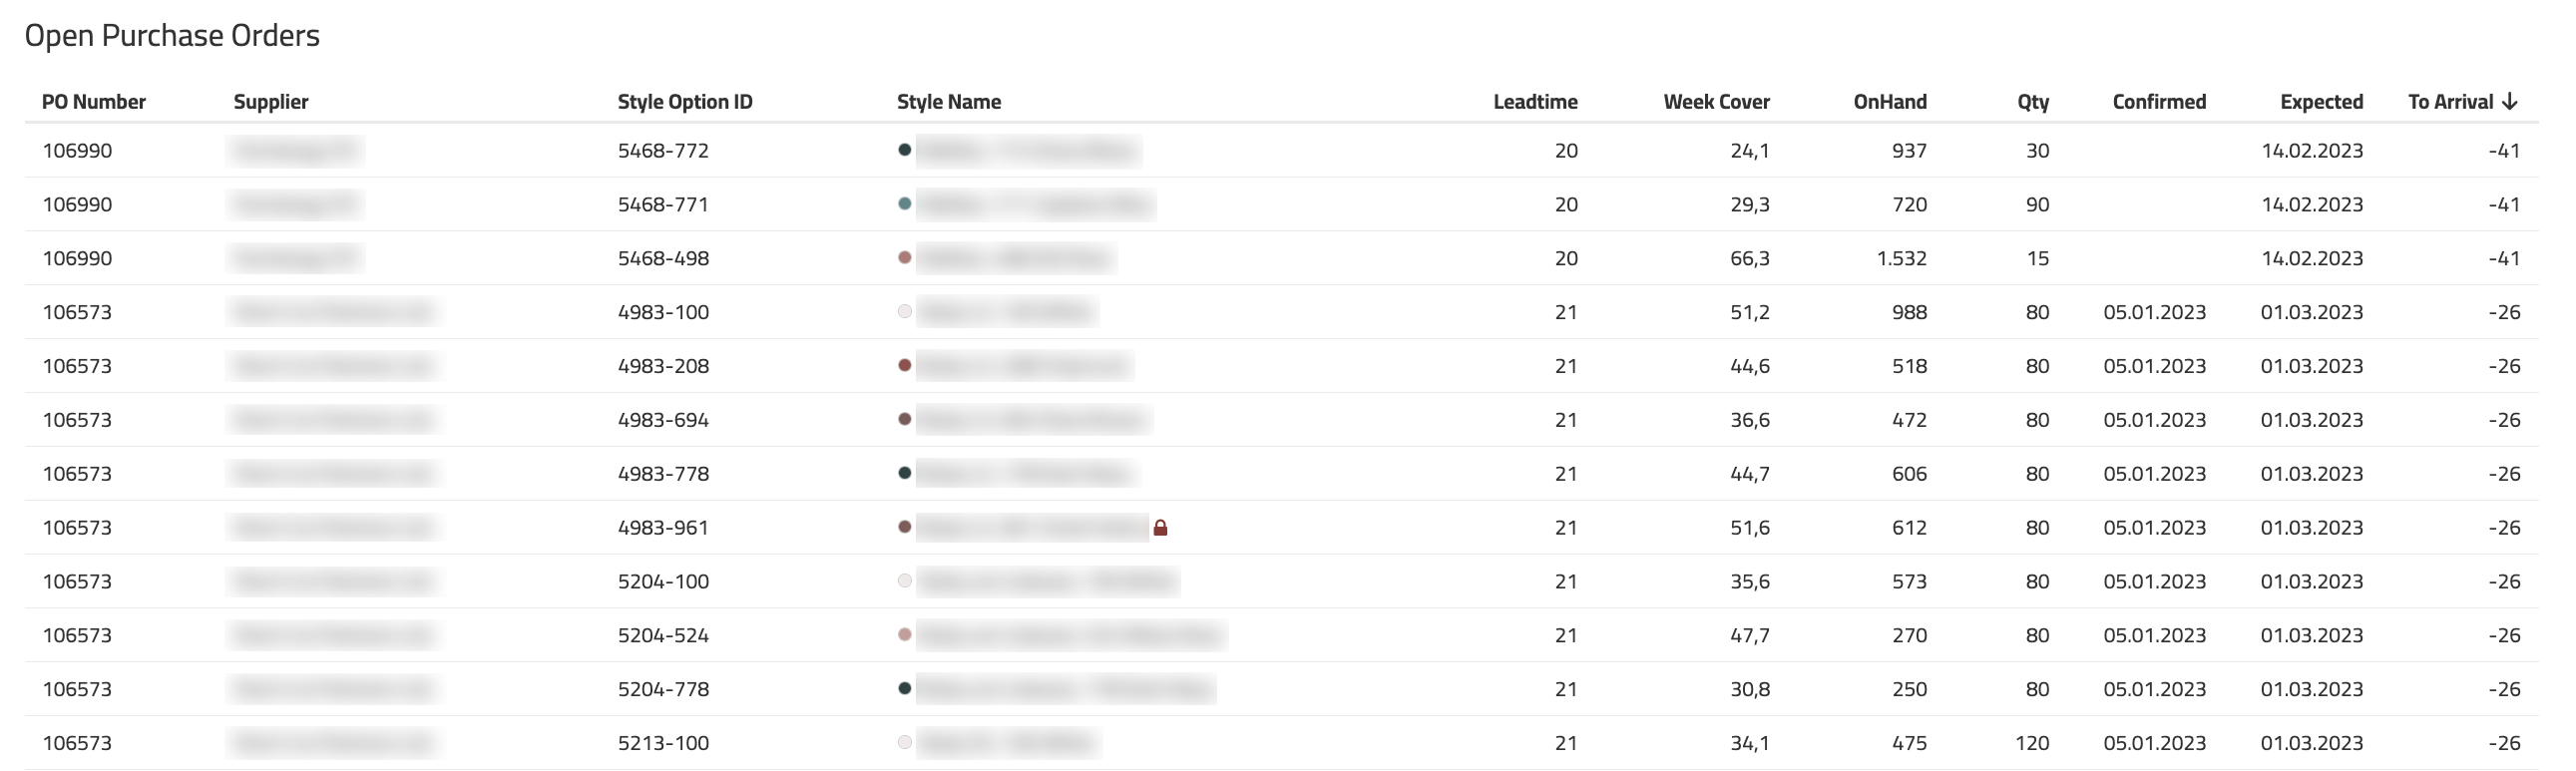
OPEN PURCHASE ORDERS REPORT
The report shows all open shopping lines on style options. It is possible to see the number of days until expected receipt, so you can follow up on orders that should have been received.
TIP: Find unsuitable purchases by sorting the report by decreasing week cover and quickly see if anything has been ordered that may not make sense
It is possible to view sizes for a style by clicking on “Style Option Id”. In this screen, you will see all future orders on the selected style option – and the specific purchase order you pressed will be unfolded at size level.
It is also possible to tap on the order number in the report, which will show an overview of the entire purchase order, where the line you clicked on will be unfolded at the size level.
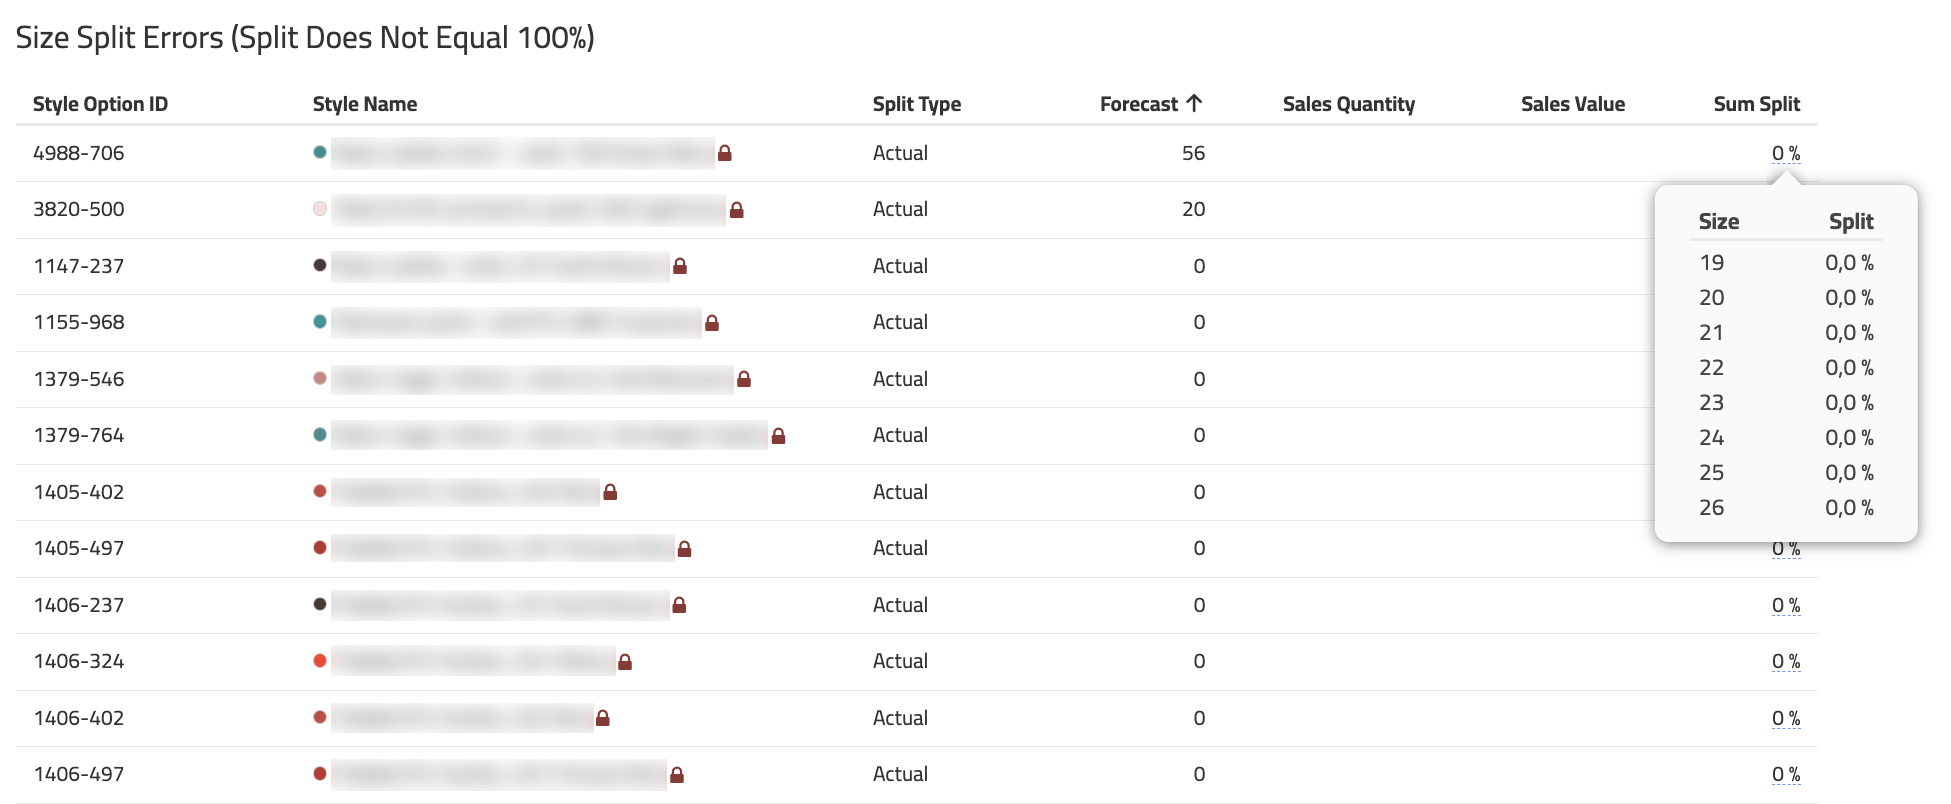
SIZE SPLIT ERROR REPORT
The report shows the styles that do not have a correct size split. It typically occurs with new styles that have no sales history or older styles where you add or remove a size. It is important to correct the styles, otherwise, correct suggestions will not be formed – Styles with 0 in split will not form suggestions at all.
You can see the individual sizes and their split by hovering your mouse over “Sum split”.
30 MARKING STYLES IN REPORTS AND LINK TO THE PLANNING SCREEN
In style name reports, icons indicate whether the product is blocked (padlock) or new (star). Blocked and days since the first receipt can typically also be selected as a filter in the reports.
It is possible to navigate directly to the planning screen by tapping on a product in the reports.
31 REPORTING - EXCEL CUBES AND POWER BI MODEL
Lost sales and weighted availability have been added to reporting models.
Sales details in the Excel cube are now tied to the delivery date instead of the creation date, which is consistent with what you see in FashionBoard. Using the period dimension for “Created Date” is possible if you want to report on the creation date.